PortMap Tutorial
Welcome to the PortMap Tutorial! This tutorial was designed to teach you how access PortMap, add geographic data, and make that data interactive.
You can find more information about PortMap
here.
This tutorial was not designed to teach you how to code. However, you do not need coding experience to follow this tutorial. Each step will guide on
how to get PortMap up and running. Our hope is that this tutorial will grow your curiosity in coding, geography, and mapping applications. We encourage you
to continue building your knowledge after you complete this tutorial.
There are many online resources that offer free HTML and JavaScript (JS) lessons. The links below are just a couple offered by
w3schools:
Getting Started
There are some resources you'll need before starting the PortMap tutorial:
1. A text editor for writing HTML and JS. There are a few text editors out there free to download. Below are some great options:
2. A Mapbox Account. Go over to Mapbox and create an account.
3. A Mapbox Access Token. PortMap is built with Mapbox GL JS and you'll need an Access Token to pull its resources. You can find your Access Token in your Mapbox Account.
Part 1: Download PortMap
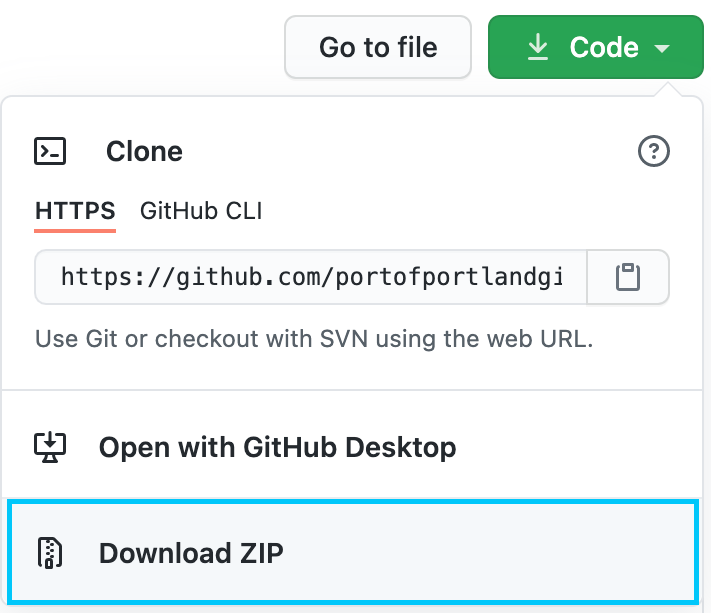
Go over to Github to find the repository for PortMap.
There are a several ways you can access PortMap's code, but in this example you'll simply download a zipped file and save to your computer. Unzip the portmap-master file when the download is complete.
Copy the unzipped portmap-master folder somewhere on your computer's file system. For example, use C Drive on Windows or /documents on Mac OS.
Part 2: Initiate Map
You'll need your Mapbox Access Token in order to associate your account with Mapbox resources used in PortMap. Refer back to the Getting Started section for more information about Mapbox Access Tokens.
In your favorite text editor, open portmap-master > assets > js > map.js
Now copy and paste your Mapbox Access Token between the apostrophes found on the first line and save
mapboxgl.accessToken = 'paste mapbox access token here';
Now you'll need to run PortMap on a server or a localhost. Running a localhost is a popular way developers test, create, and run code. This tutorial will not show you how to run a localhost. Running a localhost can vary depending on working environment or operating system i.e. Mac OS or Windows. There are so many tutorials out there that can help guide you through the process. YouTube video tutorials is a great place to start.
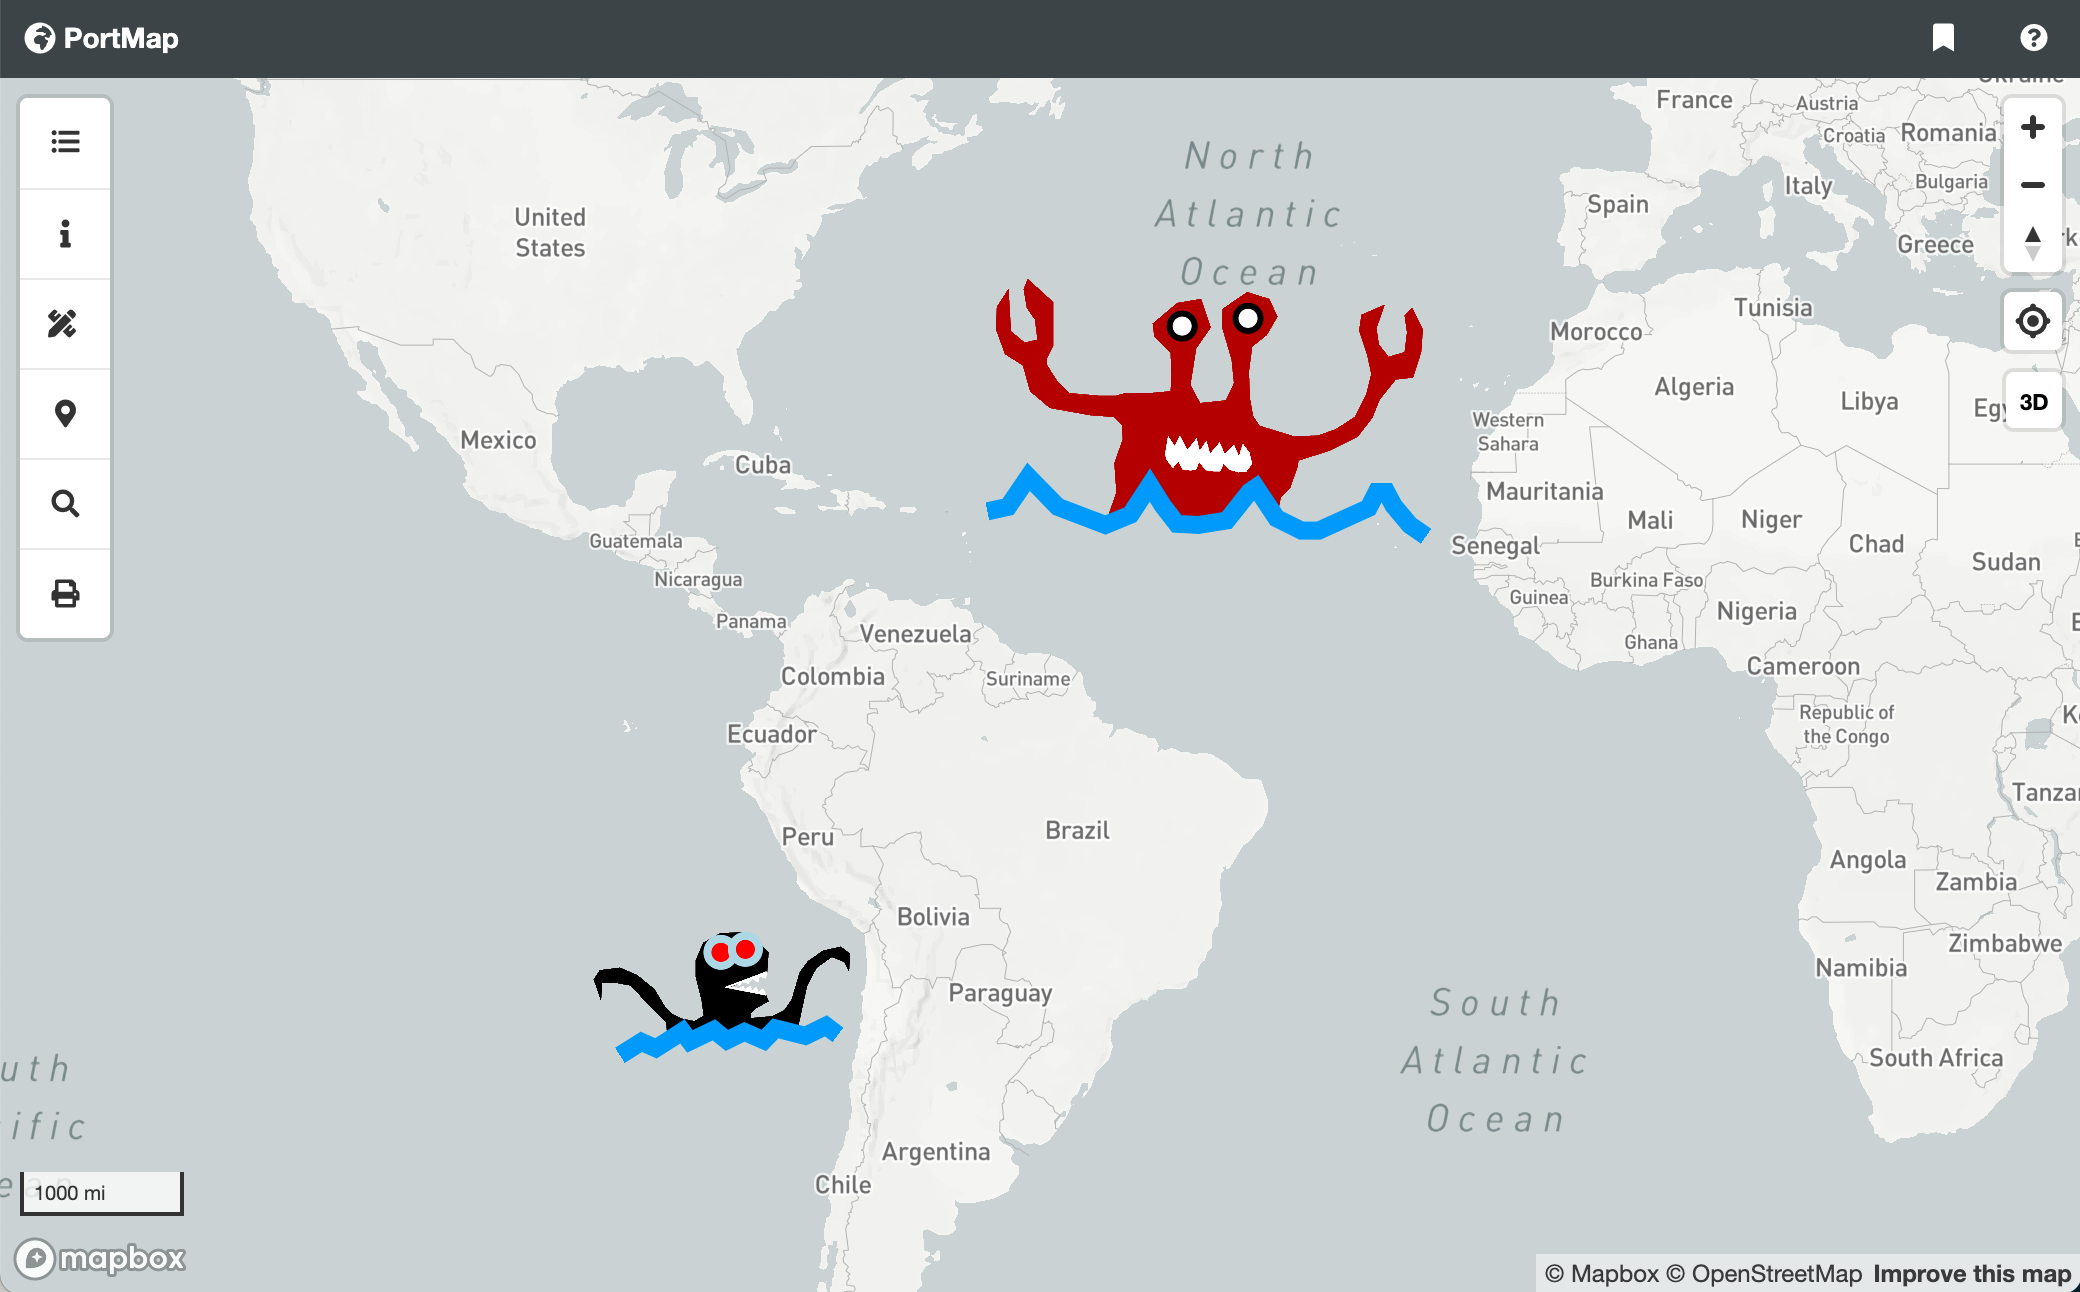
When you have your localhost running you should see PortMap fully operational in our browser:
Part 3: Download Data
Now that you have PortMap running on a localhost, it's time to add some geographic data to PortMap.
This tutorial will show you how to add GeoJSON data into PortMap. More information about the GeoJSON data format can be found here. Go ahead and download this GeoJSON file that contains major lakes from around the world:
Save the lakes.geojson file to the following folder: portmap-master > assets > json
Part 4: Add Data
Time to add some geographic data to the PortMap! There are three parts to adding data in PortMap. First is adding a data source. Second is adding the data source layer configuration. Third is connecting the data to the interactive Layer Tree. The Layer Tree is a plugin built for PortMap that allows the user to turn layers on and off. You can find more information about the Layer Tree Plugin here. Let's start with adding the data source:
In your text editor, open portmap-master > assets > js > map.js
Use your text editor's search feature and search for the following lines of code in map.js
    map.on('load', function () {

      //monster layers
      //Mr. Claw layer sources
      map.addSource('monster', { type: 'geojson', data: emptyGJ });
      map.addSource('mouth', { type: 'geojson', data: emptyGJ });
      map.addSource('water-line', { type: 'geojson', data: emptyGJ });
      map.addSource('eyes', { type: 'geojson', data: emptyGJ });

      map.addLayer({
          "id": "monster",
          "type": "fill",
          "source": "monster",
          "layout": {
        //"visibility": 'none'
          },
          "paint": {
              'fill-color': '#b30000',
              'fill-opacity': 1.0
          }
      });
Now let's add the data source:
    map.on('load', function () {

      //ADD THE CODE BELOW
      //lake data source
      map.addSource('lakes', { type: 'geojson', data: emptyGJ });
      //ADD THE CODE ABOVE

      //monster layers
      //Mr. Claw layer sources
      map.addSource('monster', { type: 'geojson', data: emptyGJ });
      map.addSource('mouth', { type: 'geojson', data: emptyGJ });
      map.addSource('water-line', { type: 'geojson', data: emptyGJ });
      map.addSource('eyes', { type: 'geojson', data: emptyGJ });

      map.addLayer({
          "id": "monster",
          "type": "fill",
          "source": "monster",
          "layout": {
        //"visibility": 'none'
          },
          "paint": {
              'fill-color': '#b30000',
              'fill-opacity': 1.0
          }
      });
Now add the data layer configuration:
map.on('load', function () {

//lake data source
map.addSource('lakes', { type: 'geojson', data: emptyGJ });

//ADD THE CODE BELOW
map.addLayer({
  "id": "lakesData",
  "type": "fill",
  "source": "lakes",
  "layout": {
//"visibility": 'none'
  },
  "paint": {
      'fill-color': 'blue',
      'fill-opacity': 1.0
  }
});
//ADD THE CODE ABOVE
Now it's time to connect the data source and layer configuration to the Layer Tree. Use your text editor's search feature and search for the following lines of code:
  // organize layers in the layer tree
  var layers =

  [
Finally, add the Layer Tree configuration code for the Lakes data:
// organize layers in the layer tree
var layers =

[

    //ADD THE CODE BELOW
    {
        'name': 'Lakes',
        'id': 'lakesData',
        'source': 'lakes',
        'path': 'assets/json/lakes.geojson',
        'directory': 'Physical',
    },
    //ADD THE CODE ABOVE
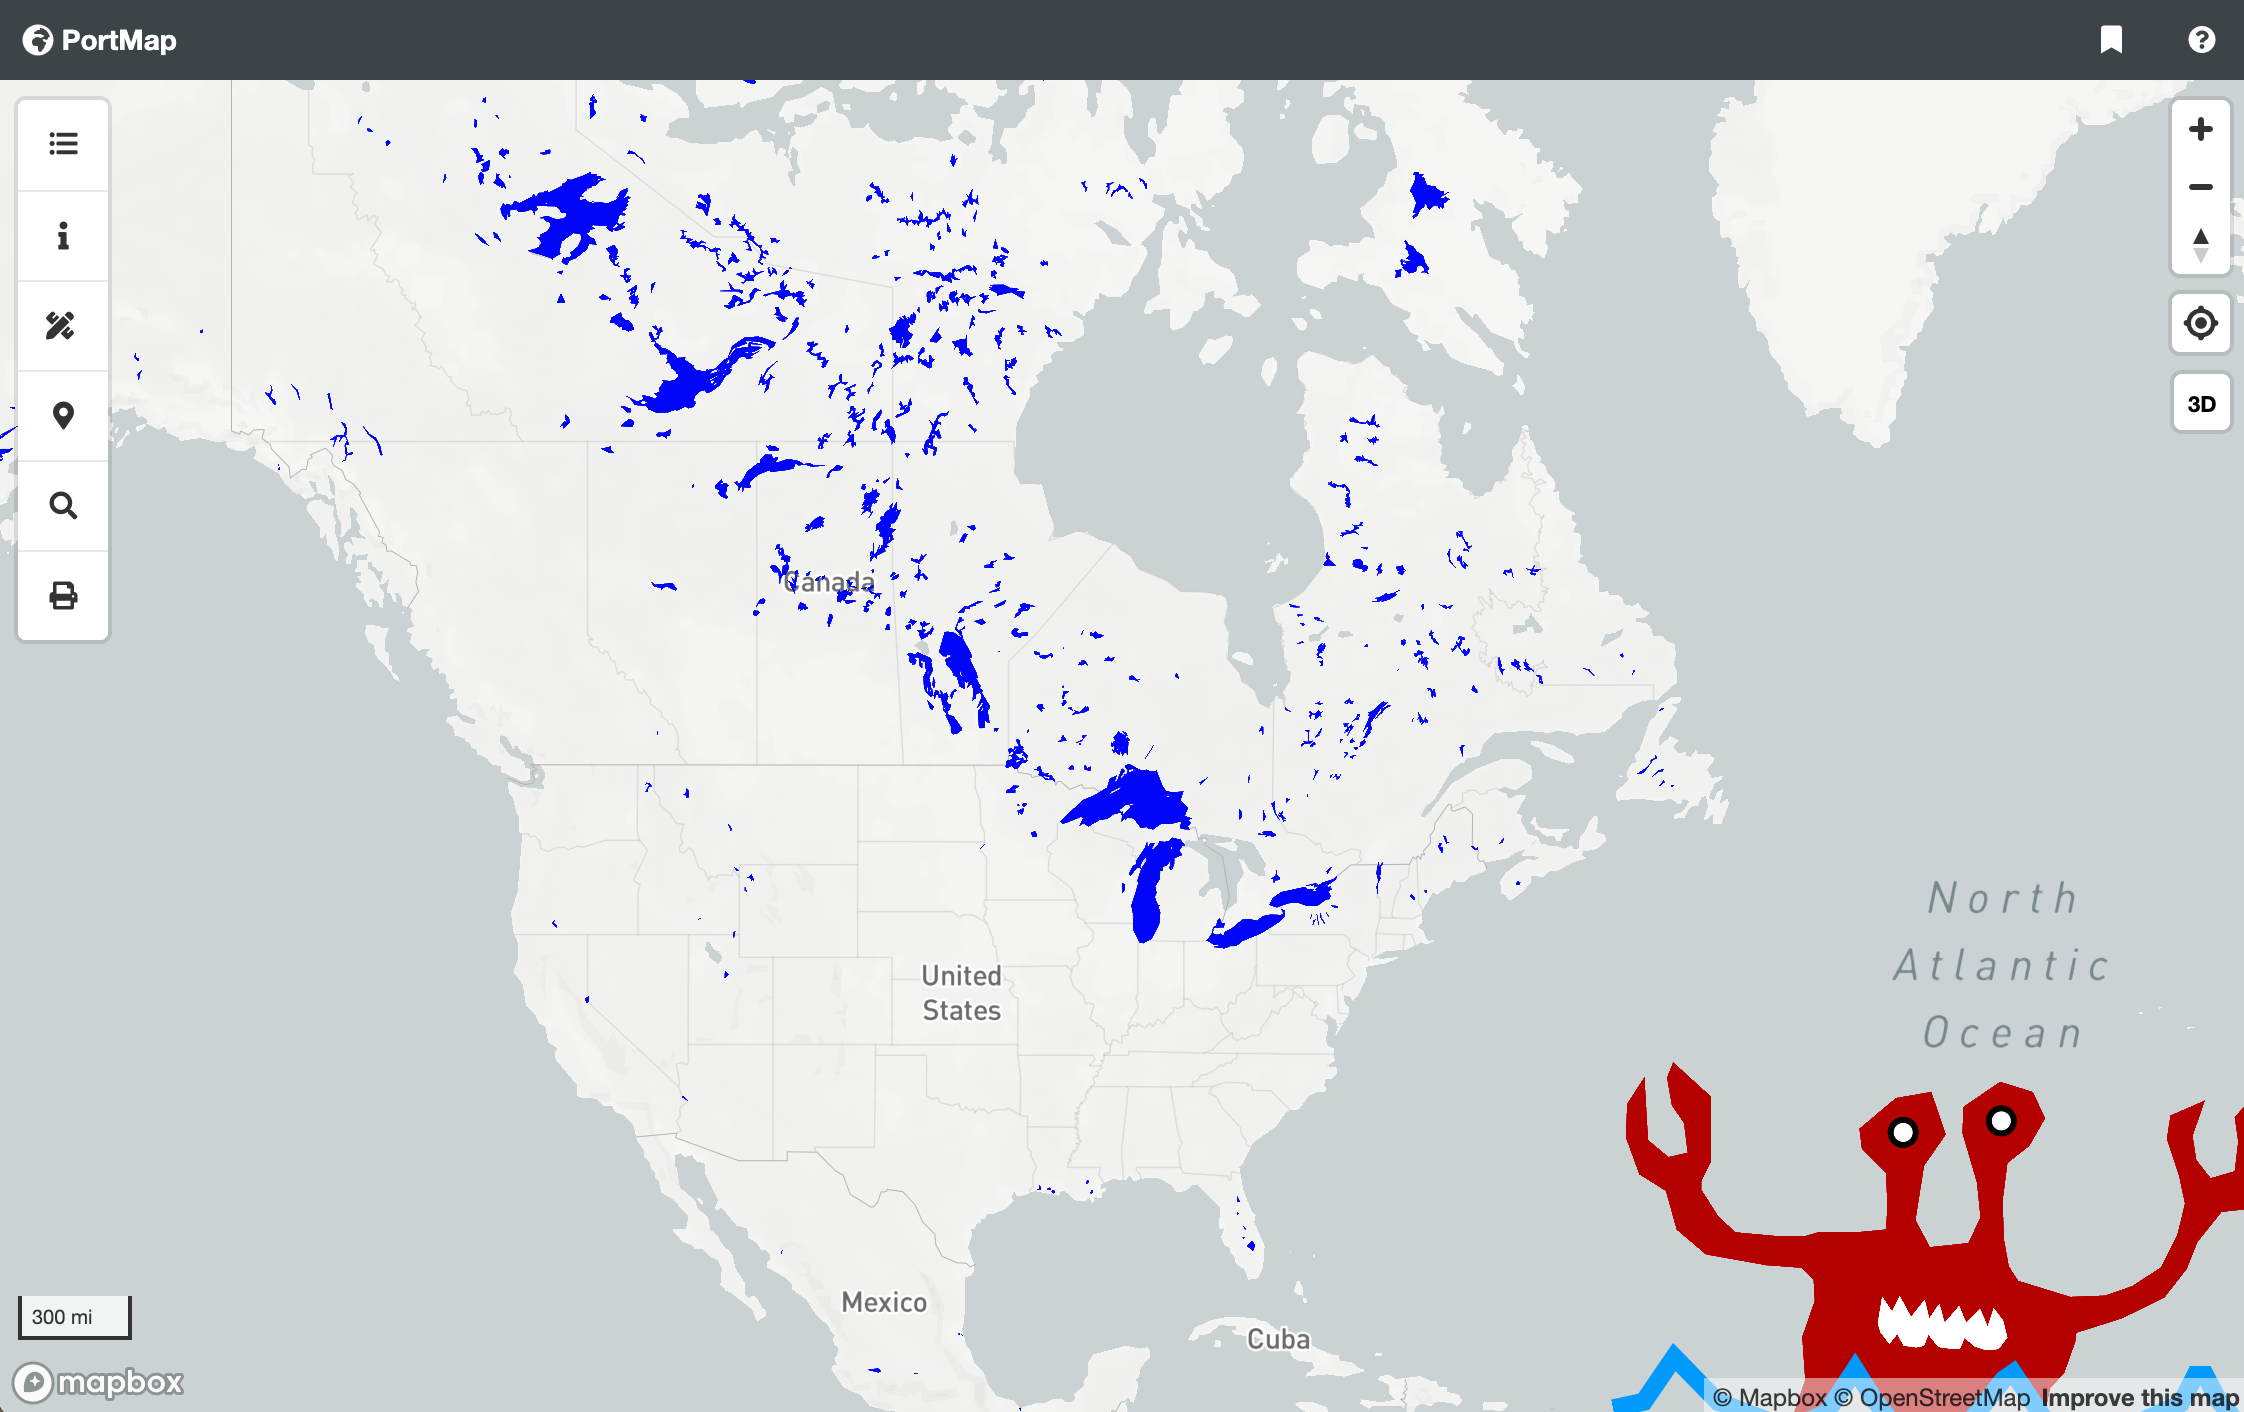
Save your file and refresh the browser. You can now see the Lakes render on the map! Additionally, you can toggle the Lakes layer on and off in the Layer Tree:
Part 5: Highlight Data
Time to make your data interactive. In this section you'll add code that lets the user click any Lake on the map to highlight the feature. Again, use your text editor's search feature to find the code below in map.js
// organize layers in the layer tree
var layers =

[

map.on('mousemove', function (e) {
  var features = map.queryRenderedFeatures(e.point, {
      layers: ['ocean', 'river', 'country', 'populated', 'monster', 'octo']
  });
  map.getCanvas().style.cursor = (features.length) ? 'default' : '';
});
The code above is simply telling the mouse cursor to change to a pointer when the cursor hovers over a data feature. Follow the example below to add the Lakes data:
layers: ['ocean', 'river', 'country', 'populated', 'monster', 'octo', 'lakesData']
Finally, you'll add code that will highlight a Lake feature anytime you click on a Lake in the map.
  //cursor = pointer on hover configuration
  map.on('mousemove', function (e) {
      var features = map.queryRenderedFeatures(e.point, {
          layers: ['ocean', 'river', 'country', 'populated', 'monster', 'octo', 'lakesData']
      });
      map.getCanvas().style.cursor = (features.length) ? 'default' : '';
  });

  //Highlight Features Function
  //Highlight Features Function
  //Highlight Features Function
  //Highlight Features Function

  //ADD THE CODE BELOW
  map.on(touchEvent, function (e) {
      var features = map.queryRenderedFeatures(e.point, { layers: ["lakesData"] });

      if (map.getLayer("lakesData_hl")) {
          map.removeLayer("lakesData_hl");
      }

      if (features.length) {

          map.addLayer({
              "id": "lakesData_hl",
              "type": "line",
              "source": "lakes",
              "layout": {},
              "paint": {
                  "line-color": "cyan",
                  "line-width": 3
              },
              "filter": ["==", "name", features[0].properties.name],
          });
      }
  });
  //ADD THE CODE ABOVE
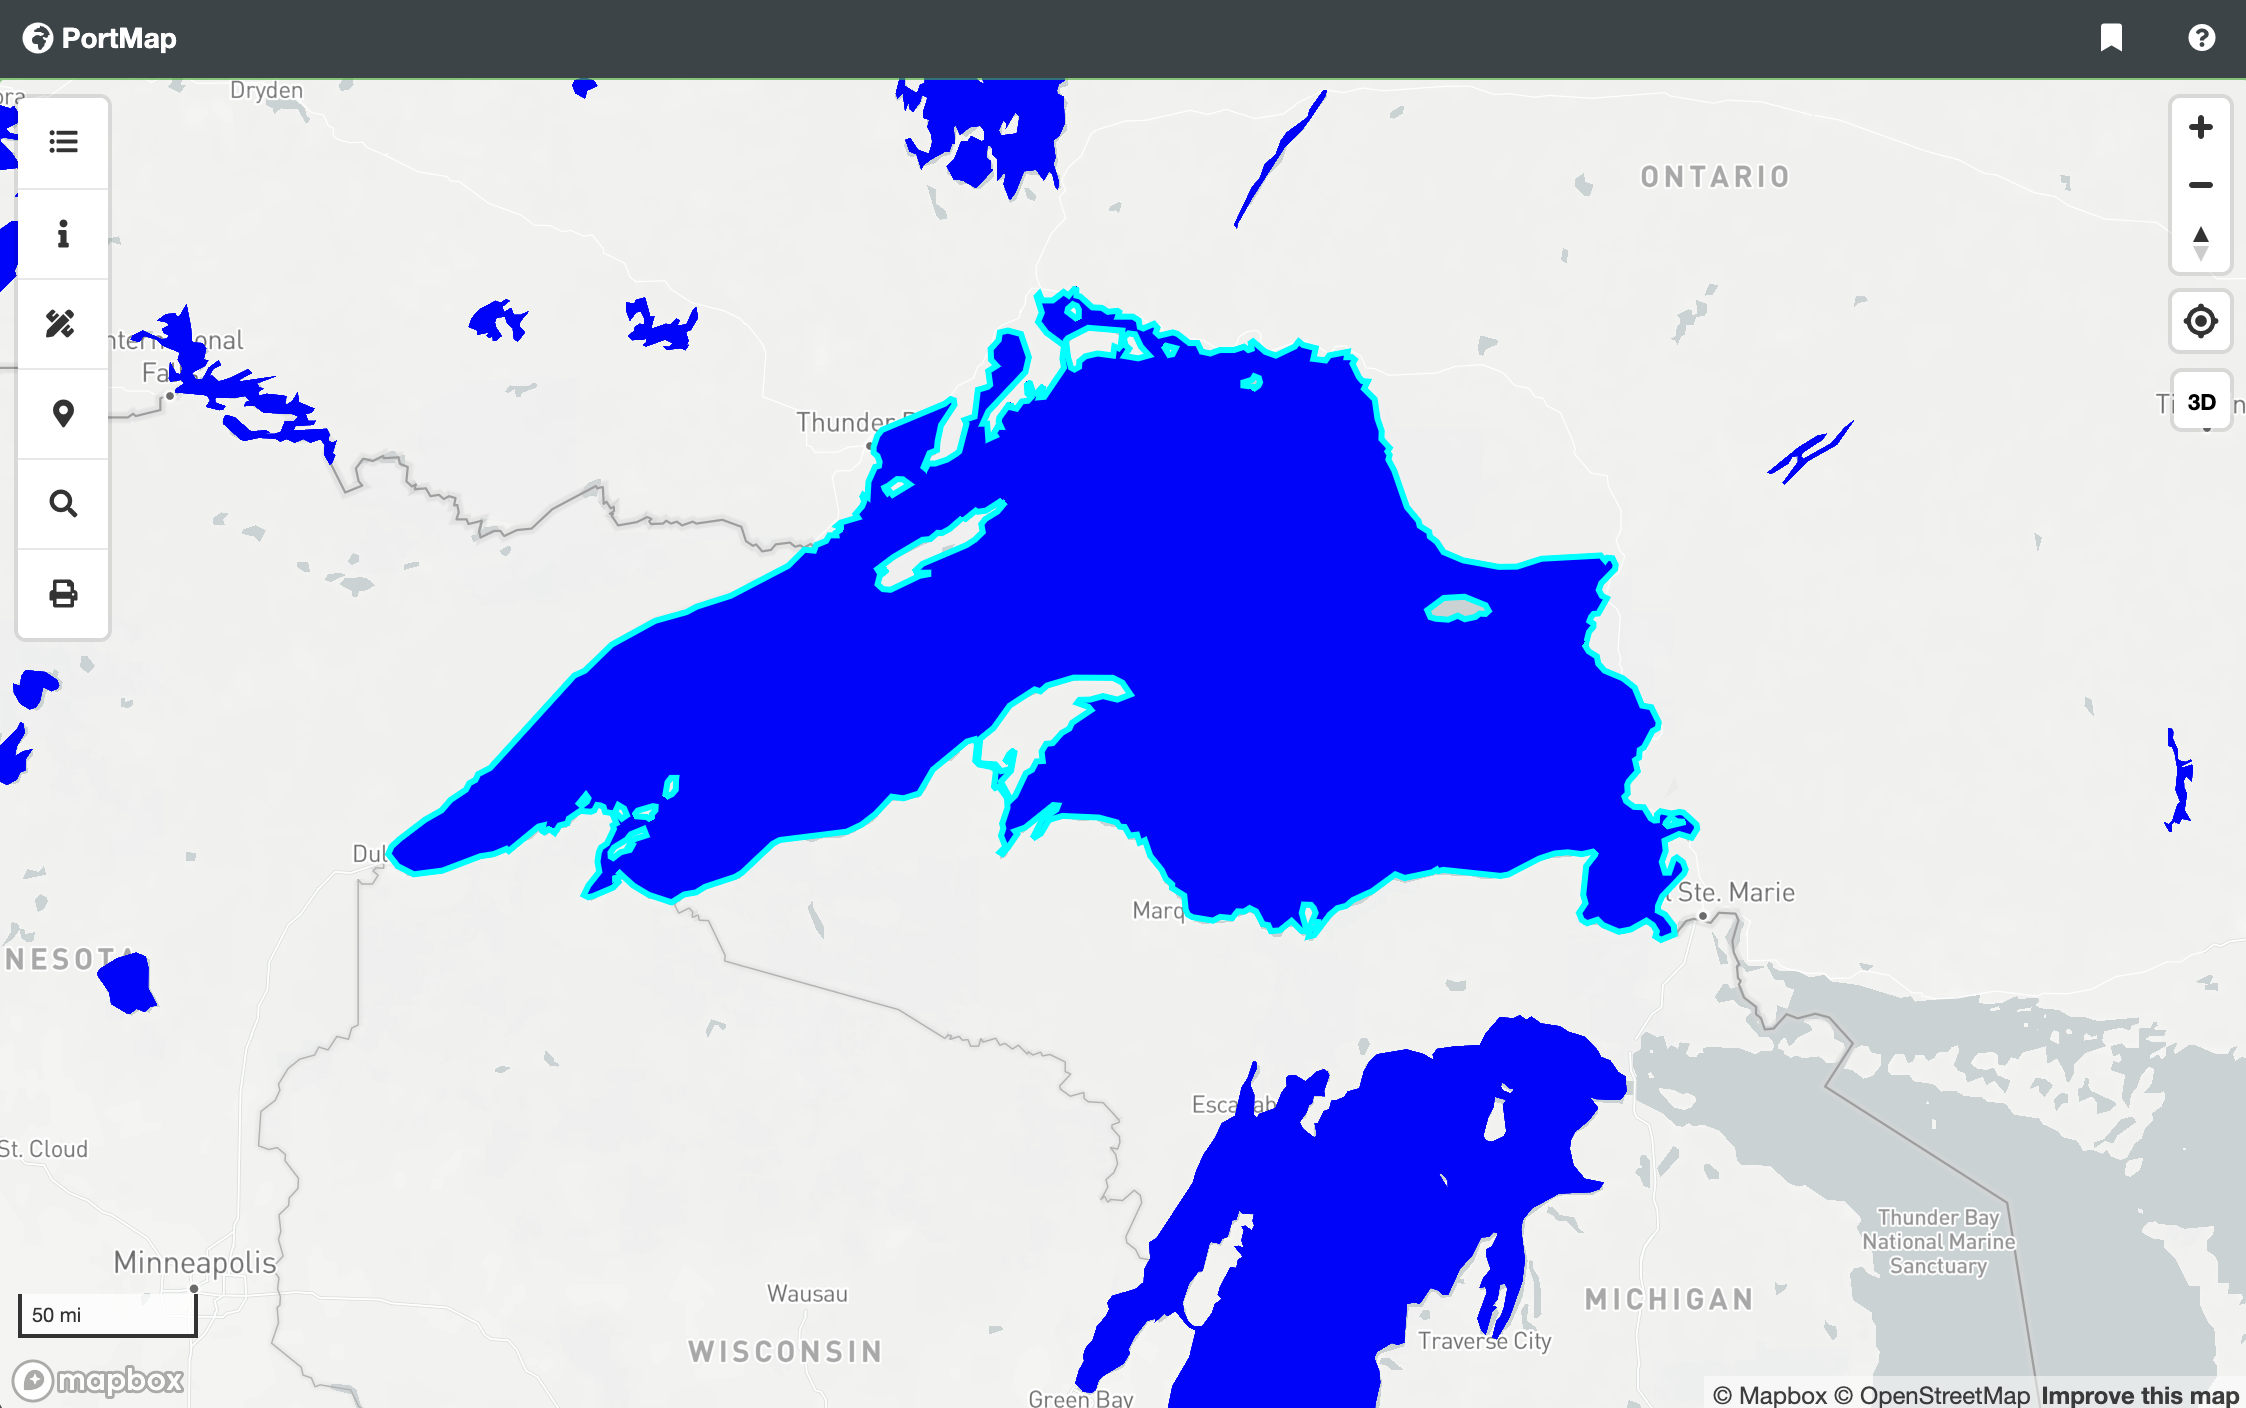
Save your file and refresh your browser. Try clicking on a Lake to see it highlight:
Part 6: Identify Data
In this section you'll link the Lake GeoJSON properties with PortMap's Identify Tool. First, in your text editor, open portmap-master > assets > json > lakes.geojson
Take notice of how the GeoJSON is structured, particularly the nested "properties" of each Lake feature. This is where you'll find information about each of the lakes in the GeoJSON. Below is a segment from the lakes.geojson file:
    {
      "type": "FeatureCollection",
      "features": [
          {
              "type": "Feature",
              "properties": {
                  "scalerank": 9,
                  "name": "Egridir",
                  "name_abb": "Egridir",
                  "name_alt": null,
                  "note": null,
                  "delta": "New or modified in version 1.2",
                  "dam_name": null,
                  "year": -99,
                  "admin": null,
                  "featureclass": "Lake"
              },
              "geometry": {
                  "type": "Polygon",
                  "coordinates": [
                      [
                          [
                              30.809772560176526,
                              38.27068831058753
                          ], ......
Now it's time to connect the Lake GeoJSON properties with the Identify Tool.
In your text editor, open portmap-master > assets >
js > map.js
Use your text editor's search feature and search for the following lines of code:
  //Layer Info function
  map.on(touchEvent, function (e) {

      document.getElementById("layer-attribute").innerHTML = "";

  });

  map.on(touchEvent, function (e) {

      var popup = new mapboxgl.Popup();
      var feature;
      var append = document.getElementById('layer-attribute');
Update map.js with the code below. Notice how you use feature.properties.name to access the GeoJSON properties.
  map.on(touchEvent, function (e) {

    var popup = new mapboxgl.Popup();
    var feature;
    var append = document.getElementById('layer-attribute');

    //ADD THE CODE ABOVE
    if (map.queryRenderedFeatures(e.point, { layers: ['lakesData'] }).length) {

        feature = map.queryRenderedFeatures(e.point, { layers: ['lakesData'] })[0];

        append.innerHTML +=
              'Name:' + ' ' + feature.properties.name

    }
    //ADD THE CODE ABOVE
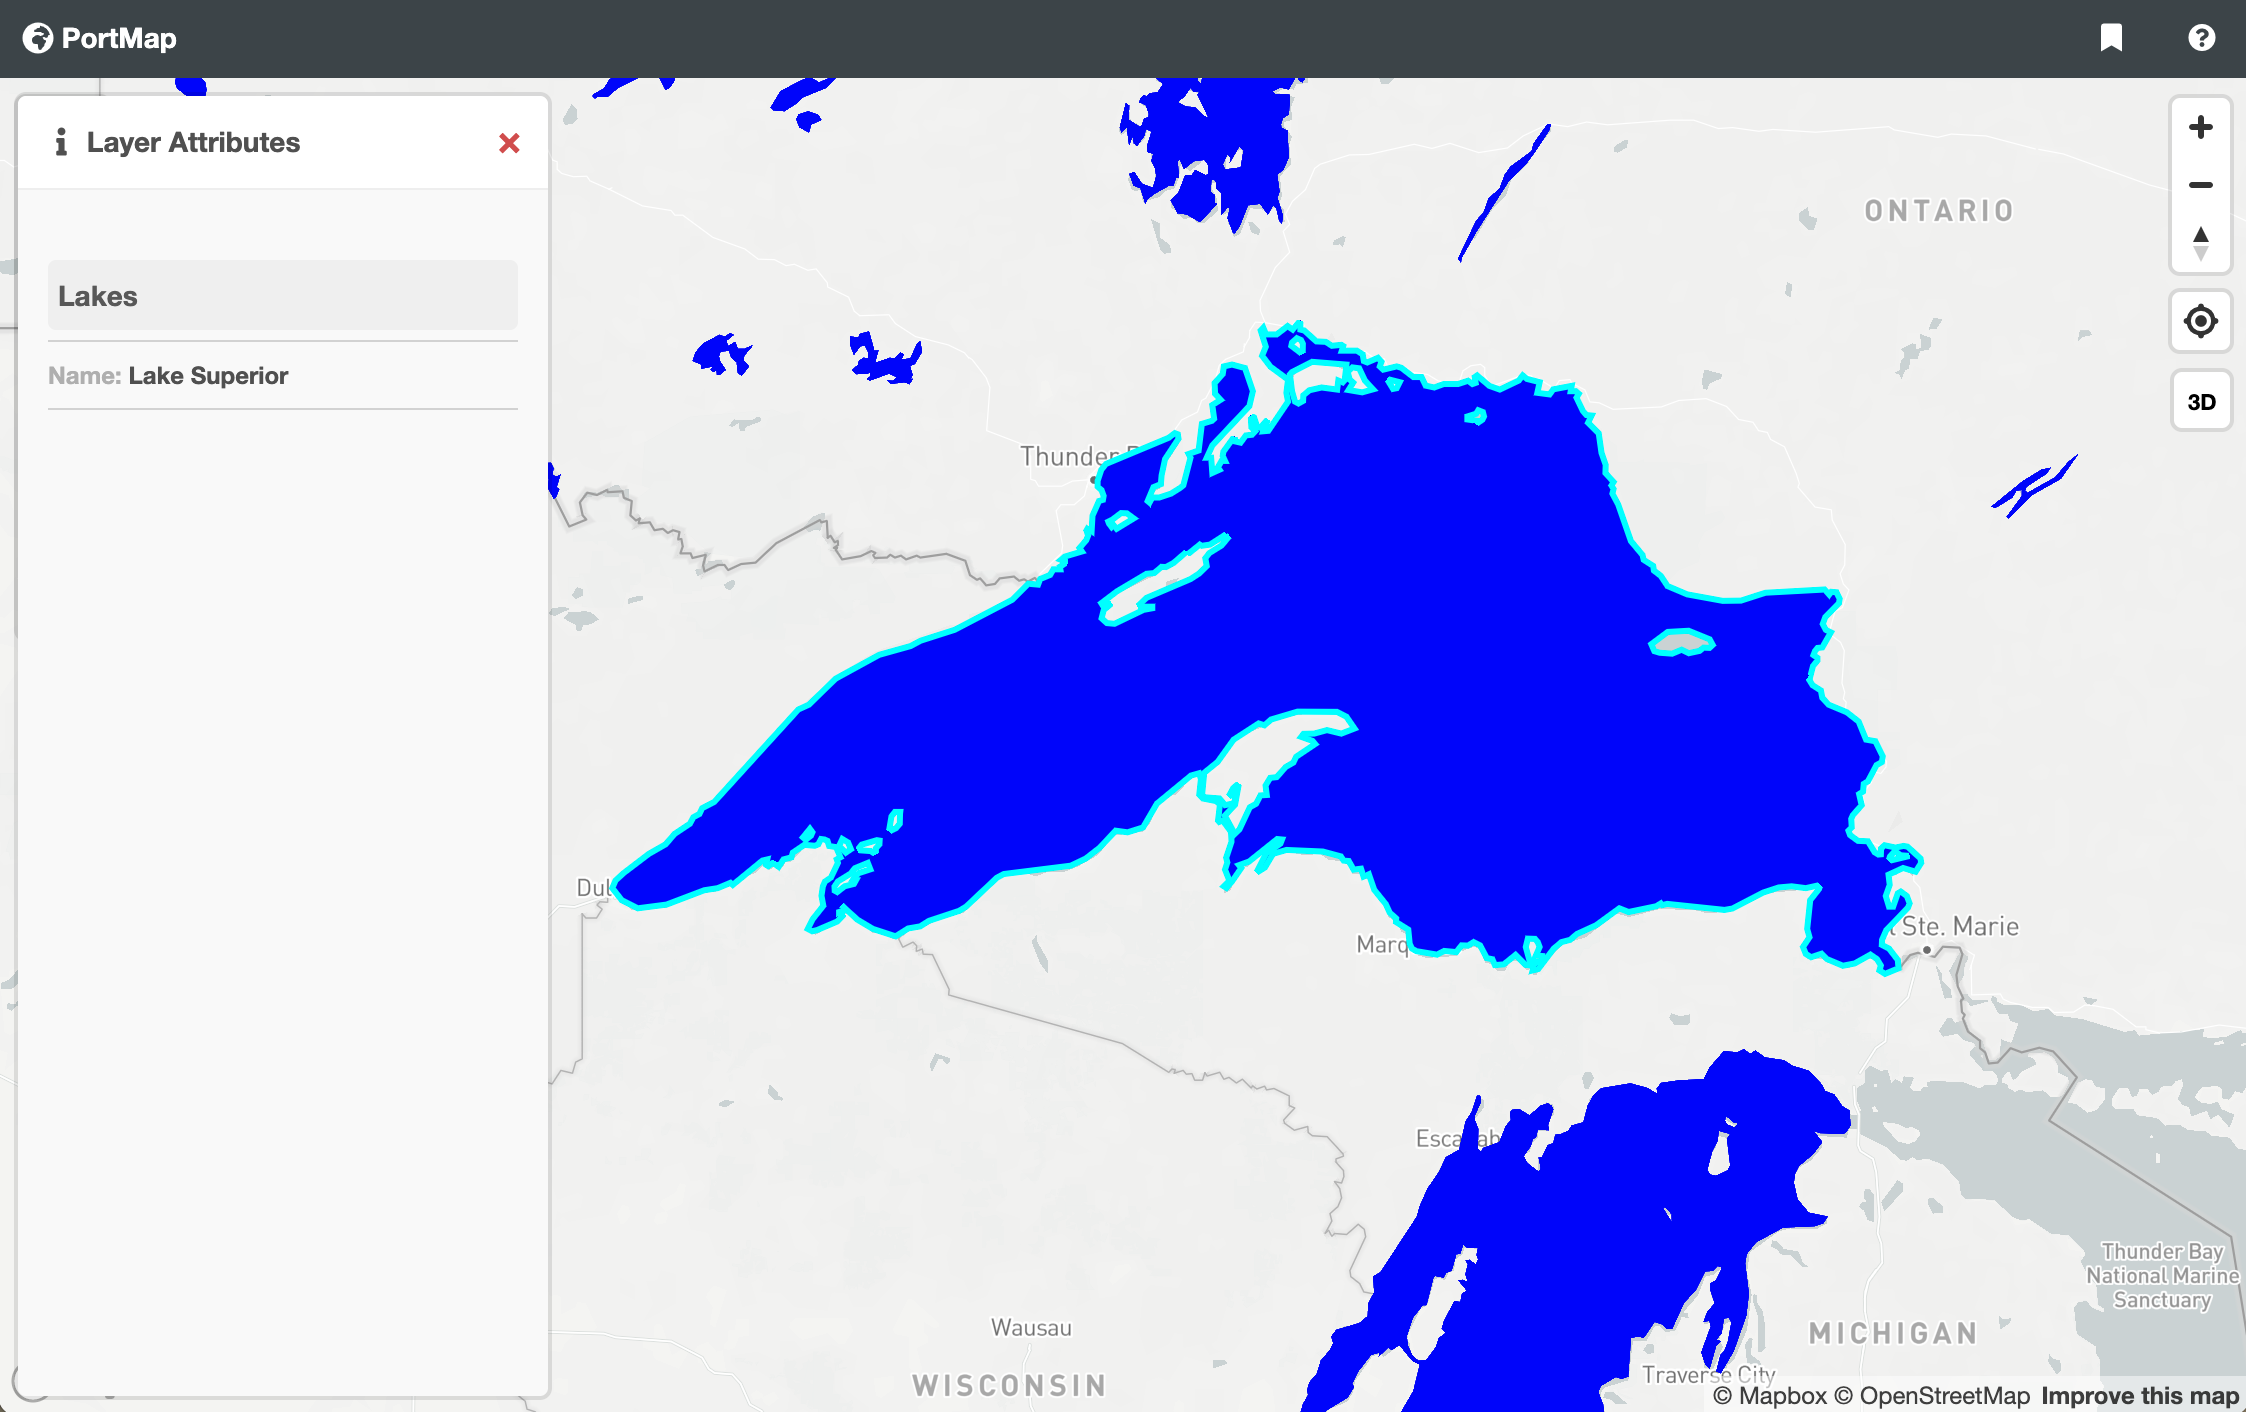
Save your file and refresh your browser. In PortMap, open the Layer Attributes dialog, or the button. Now click any of the lakes on the map. The GeoJSON properties you previously coded are now visible.
Part 7: Search Data
Finally, in this section you'll connect the Lake data to PortMap's Search Data function.
In your text editor, open portmap-master > assets > libs > jsonSearch > json > layers.json
Now add the Lake data configuration in the layers.json file. Use the code snippet below as an example:
    {
      "Layers": [
        {
          "source": "ne_50m_populated_places_simple",
          "display_name": "Populated Place",
          "name": "populated",
          "catagory": "Cultural",
          "type": "point"
        },

        {
          "source": "ne_110m_admin_0_map_units",
          "display_name": "Country",
          "name": "country",
          "catagory": "Cultural",
          "type": "polygon"
        },

        {
          "source": "ne_110m_rivers_lake_centerlines",
          "display_name": "River",
          "name": "river",
          "catagory": "Physical",
          "type": "line"
        },

        {
          "source": "ne_110m_geography_marine_polys",
          "display_name": "Ocean",
          "name": "ocean",
          "catagory": "Physical",
          "type": "polygon"
        },

        {
          "source": "lakes",
          "display_name": "Lakes",
          "name": "populated",
          "catagory": "Physical",
          "type": "polygon"
        }

      ]
    }
Save your file and refresh your browser. In PortMap, open the Search dialog, or the button. Now try using the search tools to find a lake:

Next Steps
Hopefully you found this tutorial useful. Explore the links below to see how you can personalize PortMap, or better yet, build your own open source application!
- For more information on Mapbox GL JS, check out the API Reference
- To learn how to change the appearance of data on the map, check out the Style Specifications
- Try expanding PortMap's capabilities by adding a Plugin
- Or build your own application using Mapbox GL JS Examples